# Helm 安装 Loki 以及使用 Promtail 进行日志采集(弹性集群)
安装环境:阿里云 ACK 集群 k8s 版本 1.28 Worker 节点 3 推荐单节点 4C16G 以上
# helm 更新
首先更新 Helm 源
helm repo add grafana https://grafana.github.io/helm-charts | |
helm repo update |
# helm 安装配置 s3(使用阿里云 OSS)
阿里云 OSS 兼容 S3 的配置 需要提前创建三个 Loki 需要使用的 Bucket
分别名称为 xxx-chunks xxx-ruler xxx-admin
loki: | |
commonConfig: | |
replication_factor: 1 | |
schemaConfig: | |
configs: | |
- from: "2024-01-01" | |
store: tsdb | |
index: | |
prefix: loki_index_ | |
period: 24h *#这里设置 oss 内日志保留的日期 24h 30d | |
object_store: s3 | |
schema: v13 | |
storage: | |
type: s3 | |
bucketNames: | |
chunks: xxx-loki-chunks | |
ruler: xxx-loki-ruler | |
admin: xxx-loki-admin | |
s3: | |
endpoint: oss-cn-beijing-internal.aliyuncs.com #阿里云的 endpoint 地址 这里用的内网因为在 VPC 内部署的 K8s 网络 | |
region: cn-beijing #region 不设置也可以 | |
secretAccessKey: sxxxxxxxxxxxx #SecretKey | |
accessKeyId: LTAxxxxxxxxxxxxxxxx #KeyId | |
s3ForcePathStyle: false | |
insecure: false | |
deploymentMode: SimpleScalable #部署模式选简单可伸缩 | |
backend: #后端部署 | |
replicas: 3 #副本数量 | |
persistence: #这块是自定义挂载卷后面会解释为何这么配置 | |
storageClass: alibabacloud-cnfs-nas | |
size: 5Gi | |
read: #只读 Pod | |
replicas: 3 | |
write: #写 Pod 这是个有状态副本 | |
replicas: 3 | |
persistence: | |
storageClass: alibabacloud-cnfs-nas #这块是自定义挂载卷后面会解释为何这么配置 | |
size: 5Gi | |
singleBinary: | |
replicas: 0 | |
minio: #关闭 minio 存储 这是一个本地类似 S3 结构的文件存储库 不推荐线上使用 | |
enabled: false | |
ingester: | |
replicas: 0 | |
querier: | |
replicas: 0 | |
queryFrontend: | |
replicas: 0 | |
queryScheduler: | |
replicas: 0 | |
distributor: | |
replicas: 0 | |
compactor: | |
replicas: 0 | |
indexGateway: | |
replicas: 0 | |
bloomCompactor: | |
replicas: 0 | |
bloomGateway: | |
replicas: 0 |
首先到文档列表中获取 Object Storage Configuration
链接贴上 helm 安装弹性集群
一些详细的配置修改可以参考这个链接 helm 安装 chart—values 设置
修改完之后将文件存储为 values.yaml 但现在不能直接应用需要考虑以下两个问题
# 1. 阿里云设置卷对应的默认存储
由于无状态的 backend 及有状态的 write 需要提供卷存储
backend 需要提供 BoltDB Shipper 的磁盘空间本地缓存数据 并定期上传至 S3 中
write 则需要将 log 数据暂存在磁盘中 写入数据库后清除缓存
由于以上问题 我们需要检查阿里云 ACK 中是否存在未使用的存储类 如有直接修改 value.yml 反之请创建存储类 大小建议在 20GB 以上 修改 value.yml 指定刚创建的的存储类名称
# 2. 阿里云拉取镜像问题
自 Docker 关闭中国境内的镜像源之后 大部分镜像都需要挂代理获取
现在的方案为 docker.io 内的镜像直接使用 DaoCloud 的镜像仓库 非 docker.io 的镜像将使用代理服务器或海外服务器拉取镜像并上传至私人 Docker Registy 仓库
我的方案代理服务器拉取的镜像 push 到将是阿里云的镜像仓库产品个人版 将 value.yml 对应的例如(loki.image.registry loki.image.repository) 镜像修改成阿里云镜像仓库的地址
当然可以尝试下更换 Helm Charts 仓库
# 3. 配置免密组件 SA 豁免
关于阿里云镜像问题还需要注意一个很重要的点 第三方 helm 安装的应用如果使用自己账号内镜像仓库的镜像 如果之前配置了免密插件拉取镜像 需要设置对应 SA 或者为豁免所有 SA 的使用组件的权限
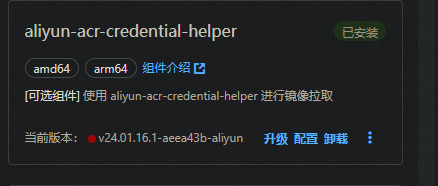
这个组件安装的位置在 kube-system 下 相关配置查看配置文件名称
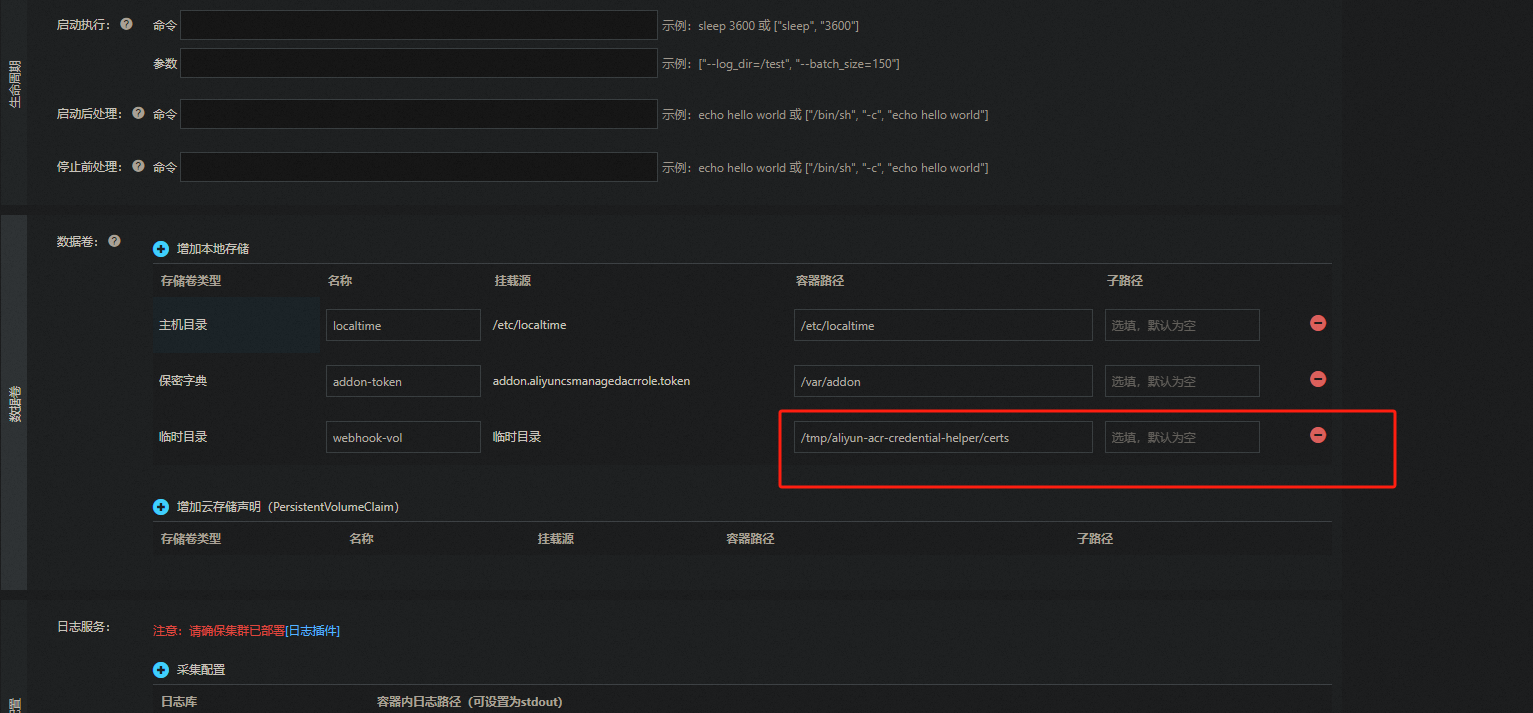
将 yaml 中 watch-namespace 修改成 all 并重启 acr 免密组件
data: | |
acr-api-version: '2018-12-01' | |
acr-registry-info: | | |
- instanceId: "" | |
expiring-threshold: 15m | |
service-account: '*' | |
watch-namespace: all |
# 4. 关闭验证与 X-Scope-OrgID
Grafana Loki 是一个多租户系统,不同租户之间的数据隔离,通过 X-Scope-OrgID 标识请求的租户。
Loki 默认以多租户模式运行 auth_enabled: true。promtail 和 Grafana 均需要验证才能访问
Grafana 租户查询隔离时,可以在 Grafana 设置 DataSource 中根据 HTTP 标头中的 X-Scope-OrgID 区分查询。
如果设置 auth_enabled: false Loki 将不进行验证 租户 ID 将设为 fake
# 安装 Promtail Damonset
设置 grafana helm 仓库
helm repo add grafana https://grafana.github.io/helm-charts
helm repo update
设置 Loki 后端地址
config: | |
clients: | |
- url: http://loki-gateway/loki/api/v1/push | |
tenant_id: 1 |
安装 protail daemonset
helm upgrade --values values.yaml --install promtail grafana/promtail |
设置 Loki 限流
使用默认的 limits_config 的配置在 Loki 后端中会出现以下的的错误
promptail-http-status-429-too-many-requests
msg="error sending batch, will retry" status=429 error="server returned HTTP status 429 Too Many Requests (429): Maximum active stream limit exceeded, reduce the number of active streams
根据限流配置调整以下配置
limits_config: | |
#摄取器速率 | |
ingestion_rate_mb: 200 | |
#摄取器极限速率 | |
ingestion_burst_size_mb: 400 | |
流 | |
per_stream_rate_limit: 512MB | |
per_stream_rate_limit_burst: 1024MB | |
max_entries_limit_per_query: 25000 | |
max_query_parallelism: 1024 |
# 安装 Grafana
没什么好说的 helm 直接安装
helm install grafana grafana/grafana --namespace monitoring |
用以下指令获取 grafana 密码
kubectl get secret --namespace monitoring my-grafana -o jsonpath="{.data.admin-password}" | base64 --decode ; echo |
之后配置好 Loki 数据源就可以使用 Loki 查询日志了
# 架构解释
# Loki 弹性架构
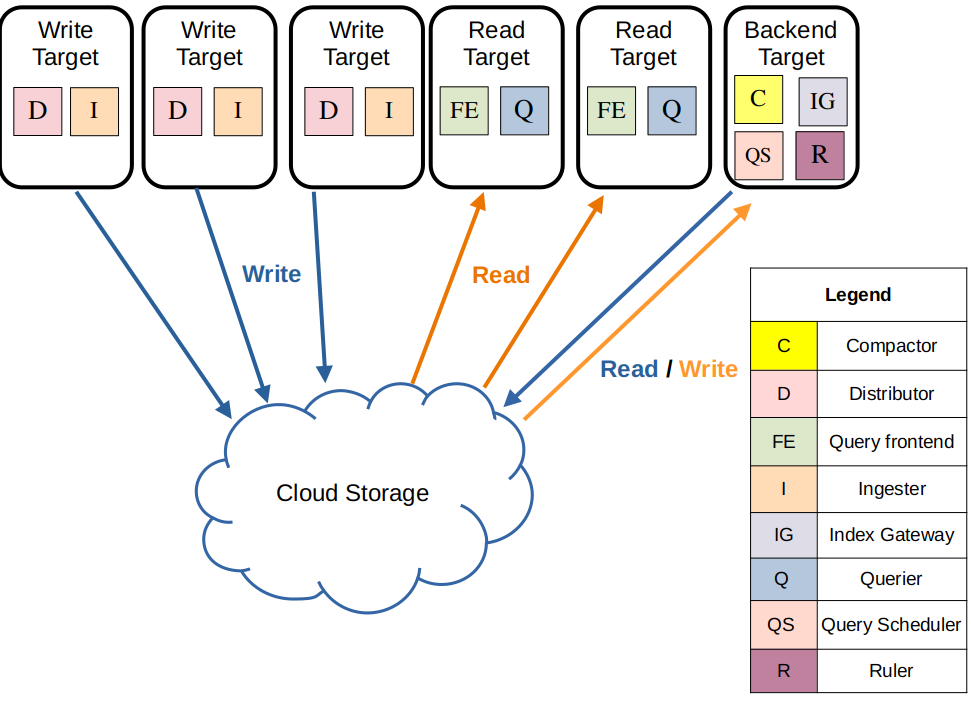
Loki 弹性架构由一个复杂的读、写、存、缓存分离架构组成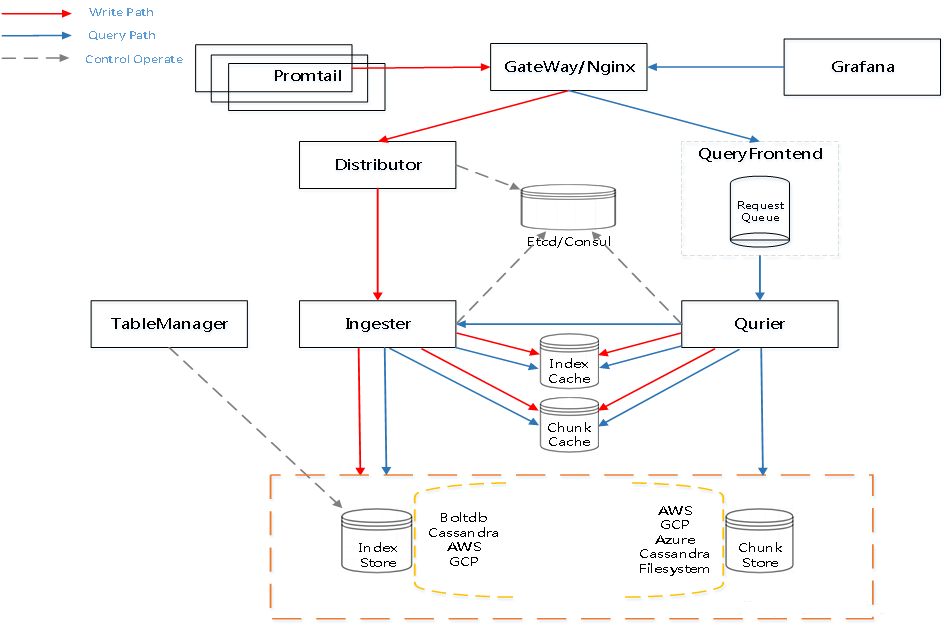
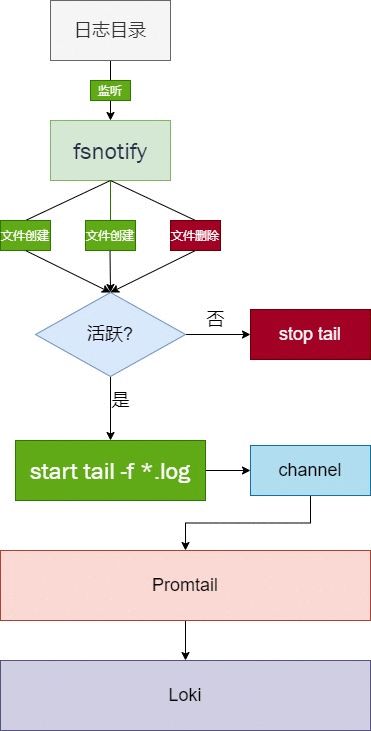
# 1. 节点中的 Promtail 以 DaemonSet 的形式分布在各个节点 用于收集日志将日志 Push 到 Loki 中
Promtail 会使用 fsnotify 监听指定目录下的日志文件的创建和删除
对活跃的日志文件会起一个 goroutine 进行类似 tail -f 的读取,读取到的内容发送给 channel
会有一个单独的 goroutine 读取 channel 中的日志行 分批处理并进行标签处理后 发送给 Loki
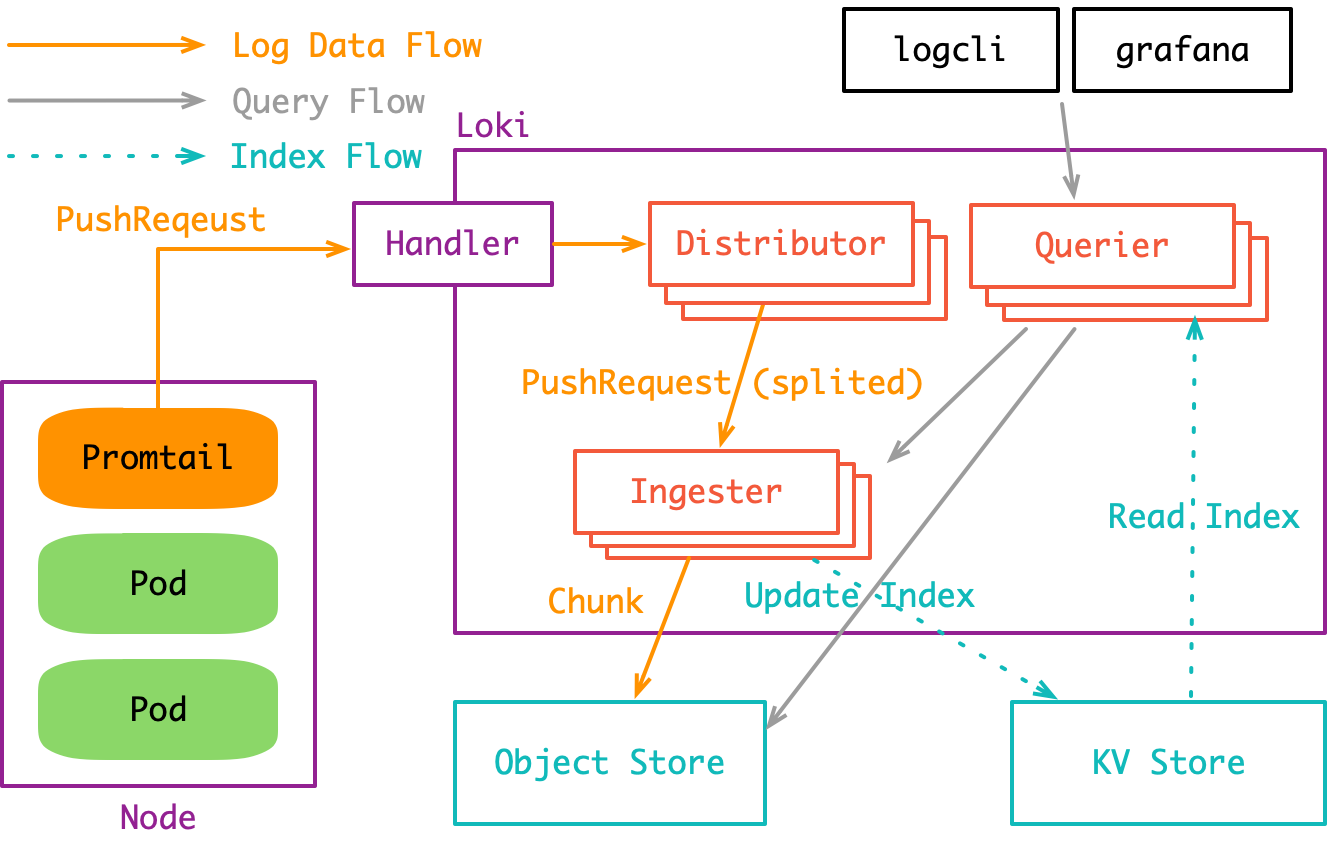
# 2.Loki 内的写流程
在弹性模式内 gateway 接收到 promtail push 的日志内容之后 会由负载均衡到 write 的多副本中任一副本
write 副本中具有 Distributor 功能 根据日志中的 TenantID、Labels 计算 Hash 根据 Hash 值分发到不同的 Ingester 上 其次功能还包括验证数据格式 标签预处理 以及速率限制等功能
write 副本中的 Ingester 会构建及刷新 Chunk 块 所有的 Chunk 块会在本地磁盘缓存(TSDB 的形式) 只有达到容量上限后 Chunk 块设为只读 并发送至 S3 存储端进行存储 并清除指定的 Chuck 信息
# 3.Index tsdb 缓存、Memcached 缓存与 Rulers
backend 副本会定期到 S3 中下载文件并进行合并、压缩 上传新的 index 到 S3 上 并在本地保存 TSDB cache
索引网关服务负责处理和提供元数据查询。主要用于 query frontend 查询 Index-Gateway 中的 chunk 引用 其中一部分主要用于指标查询
memcached 缓存两部分数据一种为 result-cache(查询结果的缓存)和 chunk-cache(由 Ingester 存储后的完整 chunk 缓存) 并在内部维护淘汰策略
backend 副本中的 Rulers 提供类似 promthus 的 AlertManager 的报警策略 另一方面 ruler 会根据评估标准配置对 query frontend 进行评估
# 4.Loki 内的查询流程
Loki 的查询一般是 Grafana 前端发出 LogQL 后经由 Gateway 指向 read 副本
其中 read 副本的 Querier 会解析 LogQL 并从 IndexGateway 中获取索引信息
优先查询 memcached 的 cache 无法查询到后将指向 S3 中的对应分片进行查询 查询出的结果将会同步结果到 result-cache 以便提高下次查询的速度
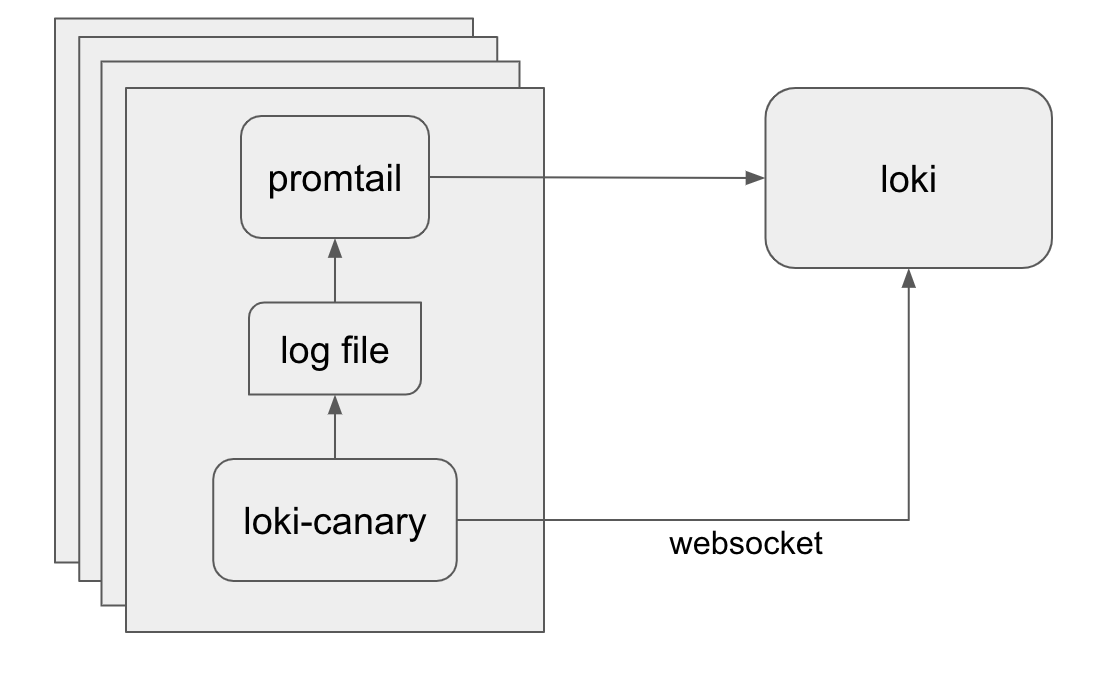
# 关于 Loki-Canary
Loki-canary 是一个相对独立的组件、主要用于 Loki 集群性能的评估
Loki-canary 作为 DamonSet 分布在各个节点上 会定期生成日志行 这些日志行会被 Promtail 采集并按照正常流程被 Loki 处理
Loki-canary 生成的 log 行一般由时间戳及填充字符串构成,之后 Loki Canary 将打开与 Loki 的 WebSocket 连接,并跟踪它创建的日志。当在 WebSocket 上收到日志时,日志消息中的时间戳将与内部数组进行比较,用以评估 Loki 的性能指标。
Loki-canary 会定期进行抽查 确保曾经上报的日志信息并没有丢失
除此之外 Loki-canary 进行指标查询 count_over_time 验证 Loki 的日志速率是否与其创建的日志速率是否相对应